| XLCubed is now FluenceXL. The new wiki can be found here: https://help.fluencexl.com/ |
Difference between revisions of "Pie Charts in Web Edition"
(Created page with "Chart in Excel before publishing: 350px|centre After publishing to web: 350px|centre To resolve this you need to: * Click on the pie ch...") |
m (moved Pie Charts to Pie Charts in Web Edition) |
(No difference)
| |
Revision as of 17:25, 30 June 2011
Chart in Excel before publishing:
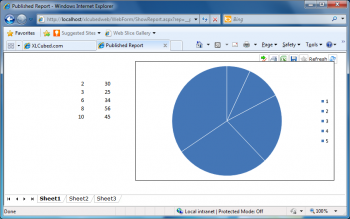
After publishing to web:
To resolve this you need to:
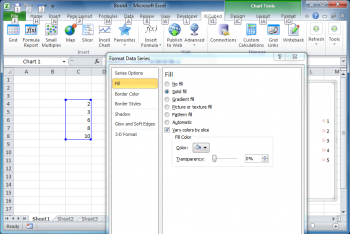
- Click on the pie chart in Excel and choose ‘Format data series’
- choose ‘solid fill’ rather than automatic and choose a fill colour - this will set everything to one colour
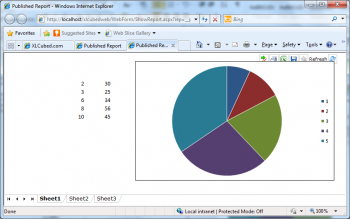
- then right-click to select each data series individually and choose ‘Format Data Point’ and set to the appropriate colour for each one
Having done that it will publish as you see it in Excel.


