| XLCubed is now FluenceXL. The new wiki can be found here: https://help.fluencexl.com/ |
Difference between revisions of "Dynamic Chart Designer"
| Line 17: | Line 17: | ||
[[File:Message Chart Comparison Values.png|center]] | [[File:Message Chart Comparison Values.png|center]] | ||
| − | Actuals and Forecast | + | The Business Scenario chart type uses the Actuals and Forecast selections |
[[File:Message Chart Business Scenario2.png|center]] | [[File:Message Chart Business Scenario2.png|center]] | ||
| − | Variance Waterfall | + | The Variance Waterfall chart type will split the selected category by the selected level. |
[[File:Message Chart Variance Waterfall.png|center]] | [[File:Message Chart Variance Waterfall.png|center]] | ||
Latest revision as of 13:39, 16 March 2020
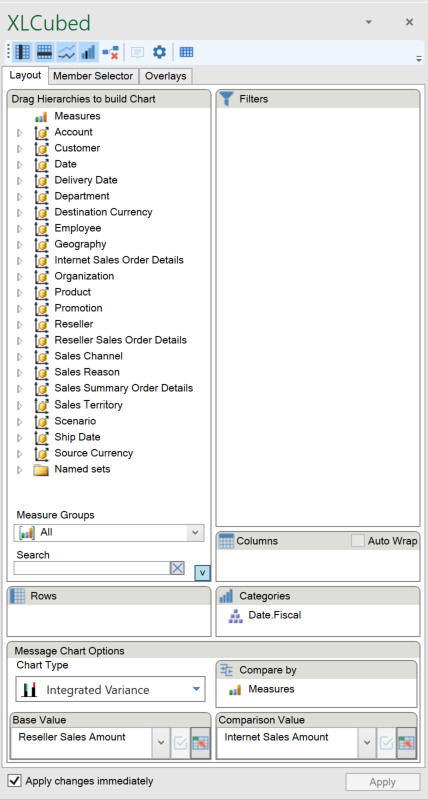
The Dynamic Chart Designer allows the creation and updating of Dynamic Charts.
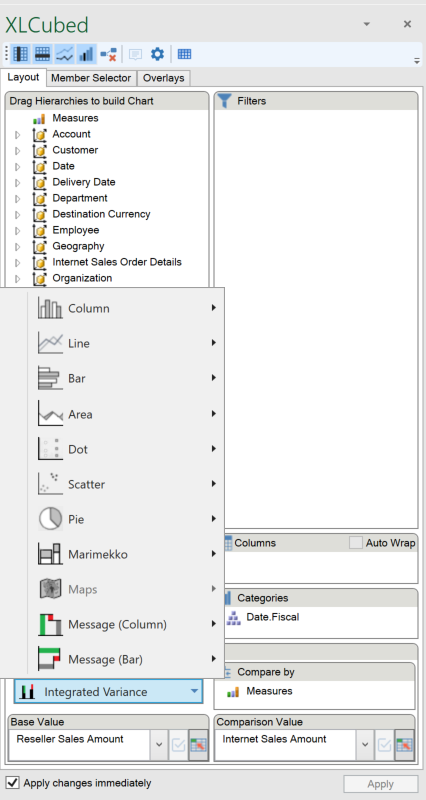
The user can select from the following chart types:-
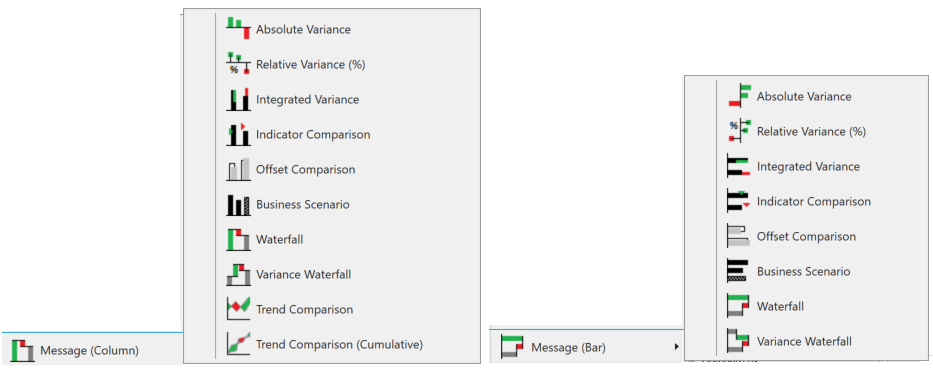
The new Message Chart types are grouped into Column and Bar types.
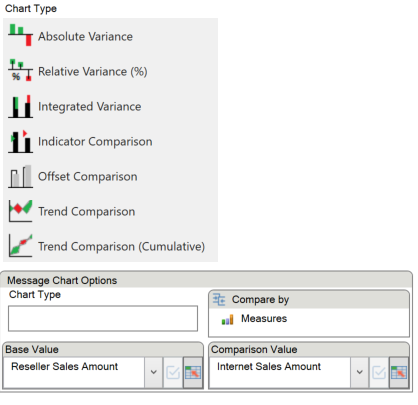
The elements displayed within the Message Chart Options area vary as a function of the Chart Type that is inserted.
Compare by controls
The Business Scenario chart type uses the Actuals and Forecast selections
The Variance Waterfall chart type will split the selected category by the selected level.


