| XLCubed is now FluenceXL. The new wiki can be found here: https://help.fluencexl.com/ |
Maps
Contents
[hide]Introduction
XLCubed Maps are an optional extension which allow plotting geographic data directly in Excel and publishing to the XLCubed Web server.
You can plot the data locations, and optionally set the colour and size of the plotted points to show values.
UI
To create a Map from Excel simply highlight the relevant data and select Maps from the Visualise drop-down button in the XLCubed menu.
XLCubed expects your data to be arranged in a particular way to create maps.
Generally there should be several columns of data as described below.
Known Latitude and Longitude
The columns should contain the following.
| Column | Description |
|---|---|
| Map Name | Title of the map, a map will be created for each different name. (For example to create a map for each year.) |
| Location Name | Title of the data point, shown when you hover over the point. |
| Latitude | Latitude of the point. |
| Longitude | Longitude of the point. |
| Colour (optional) | Defines the colour of the point plotted, can be a number or text. If no column is selected then all points will be the same colour. See Colours for more information. |
| Size (optional) | Defines the size of the point, this must be a number. If no column is selected then all points will be the same size. |
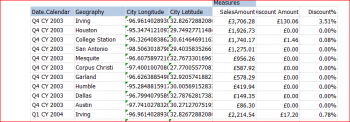
This would be a typical set of mapping data:
If you do not know the latitude/longitude you can look it up using the Extras -> Lookup Latitude/Longitude menu item.
Highlight the place names and select the menu item. This can take some time, so is not available as a function. It is recommended you look up the locations once and then reference them, for example using the VLookup() formula.
Named places
Named places uses a predefined set of codes to identify locations. You can then plot either the outline of the location of a point in its center.
XLCubed comes with defined outlines for
- Countries of the World
- US States
- UK Counties
You may also add custom sets of locations, to do this please contact support@xlcubed.com.
The columns for the report should contain the following.
| Column | Description |
|---|---|
| Map Name | Title of the map, a map will be created for each different name. (For example to create a map for each year.) |
| Location Name | Name of the place to plot. |
| Colour (optional) | Defines the colour of the point plotted, can be a number or text. If no column is selected then all points will be the same colour. See Colours for more information. |
| Size (optional) | Defines the size of the point, this must be a number. If no column is selected then all points will be the same size. (Does not apply if plotting polygons.) |
Map controls
Output cells
In the properties screen you can set up "output cells" for the map and location names.
With these selected clicking a data point will update Excel. This can then be used to drive a detailed report for the selected point.
If you turn on multi-select and pick an output range rather than a cell you can output multiple values. Drawing tools appear on the map to allow you to pick many points, and OK the selection.
Colours
This column can contain numbers or text, and there are three ways the values could drive the colour.
Firstly, if you have numbers the colours can be from a colour gradient. E.g. Red-Green shading.
Secondly, you can categorise the point. For example with stores the colour column could contain the store type. Each store type would then be plotted a particular colour.
Finally the column could contain specific colours, using named colours or Html syntax such as #ff0000. This allows you maximum flexibility to drive the colour using any criteria you choose.
All of these options are configured in the map properties screen. Right click the map to bring up the screen.


