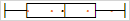
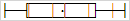
Creates a BoxPlot (also known as a box-and-whisker diagram) that is rendered in an Excel cell.
Double-clicking the chart, or selecting the XLCubed > Format In-Cell Chart... right-click menu item allow the editing of the chart format using the SparkBox Chart Designer.
Syntax
XL3SparkBox( Data, Output, InRows, [Width], [WhiskerColour], [BarColour], [BoxColour], [MedianColour], [BorderColour], [MeanDotColour], [UpperQuartileColour], [PercentileBoundary], [Minimum], [Maximum], [AxisType], [MajorTickmarkFrequency], [MinorTickmarksPerMajor], [TickmarkLabelFormatString], [Label], [WhiskerType], [DotType], [AdditionalVals1], [Val1Color], [AdditionalVals2], [Val2Color], [Val1Type], [Val2Type] )
Parameters
| Parameter
|
Description
|
| Data
|
The data to chart. This can be a range or a formula
|
| Output
|
The target range in which to render the chart(s)
|
| InRows
|
Specifies whether the input data are in rows or columns:
| 0 |
Data are in rows
|
| 1 |
Data are in columns
|
|
| Width
|
The total length of the box plot
|
| WhiskerColour
|
The colour to use for the whiskers, or -1 or an empty parameter for default
|
| BarColour
|
The colour to use for the bar, or -1 or an empty parameter for default
|
| BoxColour
|
The colour to fill the box representing the lower quartile, or -1 or an empty parameter for default
|
| MedianColour
|
The colour to use for the median line, or -1 or an empty parameter for default
|
| BorderColour
|
The colour to use for border of the box, or -1 or an empty parameter for default
|
| MeanDotColour
|
The colour to use for the mean dot, or -1 or an empty parameter for default
|
| UpperQuartileColour
|
The colour to fill the box representing the upper quartile, or -1 or an empty parameter for default
|
| PercentileBoundary
|
**Currently Unknown
|
| Minimum
|
A value to use for the minimum horizontal axis value, or an empty parameter to use an automatic value
|
| Maximum
|
A value to use for the maximum horizontal axis value, or an empty parameter to use an automatic value
|
| AxisType
|
The type of axis to render in the formula cell:
| 0 |
No axis
|
| 1 |
Draws the axis at the top of the cell, with tickmarks below
|
| 2 |
Draws the axis at the bottom of the cell, with tickmarks above
|
| 3 |
Draws the axis at the top of the cell, with tickmarks and labels below
|
| 4 |
Draws the axis at the bottom of the cell, with tickmarks and labels above
|
|
| MajorTickmarkFrequency
|
The frequency of the major, labelled tickmarks
|
| MinorTickmarksPerMajor
|
The number of additional labelless tickmarks per major tickmark
|
| TickmarkLabelFormatString
|
The format string for the axis tickmark labels
|
| Label
|
Specifies the text to use in the formula cell
|
| WhiskerType
|
Reserved
|
| DotType
|
Reserved
|
| AdditionalVals1
|
A range containing a additional series of values to plot
|
| Val1Color
|
The colour to use to plot the values specified in AdditionalVals1
|
| AdditionalVals2
|
A range containing a second additional series of values to plot
|
| Val2Color
|
The colour to use to plot the values specified in AdditionalVals2
|
| Val1Type
|
The shape to use to plot the values for AdditionalVals1
| 0 |
Points |
|
| 1 |
Lines |
|
|
| Val2Type
|
The shape to use to plot the values for AdditionalVals2. Valid values are as Val1Type
|
See Also