| XLCubed is now FluenceXL. The new wiki can be found here: https://help.fluencexl.com/ |
Dependency Explorer
The Dependency Explorer allows you to browse the connections between worksheets present in the current workbook. It shows both other worksheets and XLCubed objects that are required for the rendering of each worksheet. It can be found by selecting the XLCubed > Manage > More > Dependencies... ribbon item.
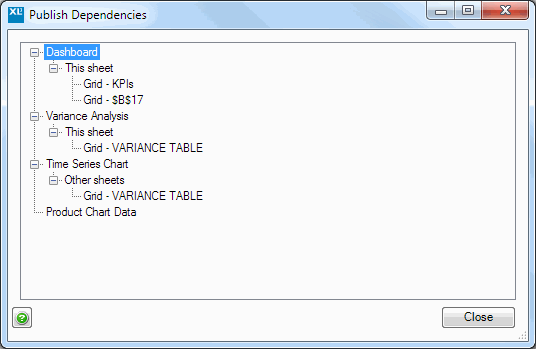
The items are shown as a tree, showing the components of the workbook. This includes the various worksheets (Dashboard, Variance Analysis and so on in the example above) then the Grids, etc. that can are required for each worksheet. If an object has been given a specific name, then it will be listed here. If not, then the location of that object is listed instead.
In the above example, the 'Dashboard' worksheet requires just the two Grids 'KPIs' and 'Grid - $B$17', both already on the 'Dashboard' sheet in order to render. In contrast, the 'Time Series Chart' worksheet requires the Grid 'VARIANCE TABLE' from a different sheet to render completely.
