| XLCubed is now FluenceXL. The new wiki can be found here: https://help.fluencexl.com/ |
Difference between revisions of "Viewports"
| (20 intermediate revisions by 8 users not shown) | |||
| Line 1: | Line 1: | ||
| − | XLCubed Viewports help with the layout of variable length or width reports | + | XLCubed Viewports help with the layout of variable length or width reports, allowing you to present information from one worksheet onto another. This can be useful in many presentation scenarios; for example, you can have separate worksheets for each business area, and bring them together on a formatted summary sheet. |
| − | This can be useful in many presentation scenarios, you can have separate worksheets for each business area, and bring them together on a formatted summary sheet. | ||
| − | + | Viewports have a number of advantages over standard Excel camera objects: | |
| − | + | '''Scrollable''' | |
| − | + | Viewports can reference a large area on the source sheet. If the Viewport control itself is smaller than the range, it will show vertical and horizontal scrollbars as required. This can be very useful for row dynamic reporting as the display area remains unchanged and additional parts of the report beneath the Viewport can remain in place even if the number of rows in the Viewport changes. They also support freeze panes so that the row and column headers can always be visible as you scroll. | |
| − | + | '''Interactive''' | |
| − | [[File: | + | If the Viewport contains a Grid, the grid is still drillable and editable even through the Viewport. If there are active cell links which update other parts of the workbook these are still interactive in the Viewport. |
| + | |||
| + | '''Able to support named ranges''' | ||
| + | |||
| + | Viewports support named ranges being specified as the area (type in the name when picking a range). This works well when combined with specifying [[Named Ranges]] on [[Grids]] or [[Tables]] that have a dynamic number of rows/columns. | ||
| + | |||
| + | ==Creating a Viewport== | ||
| + | Viewports are added from the Visualise menu on the XLCubed Ribbon. Specify the source range to be displayed, and where to insert the viewport control. You can also define the placement options and border settings as shown below. | ||
| + | |||
| + | |||
| + | <gallery style="text-align:center" mode="packed" heights="300px"> | ||
| + | Viewport92.PNG|Version 9 | ||
| + | ViewportDesign.png|Previous versions | ||
| + | </gallery> | ||
| + | |||
| + | After insertion, the viewport control can be scrolled, any grids it contains can be drilled, and xl3link() and grid active cell settings are retained. | ||
| + | [[File:Viewport.png|center|thumb|400px]] | ||
| + | |||
| + | ==Excel Limitations== | ||
| + | |||
| + | The viewport will only update when a cell value in the referenced range changes, so if it just contains a chart or image you may need to add a "Helper" cell to trigger the update. This can just be a reference to a cell that will be updated when the chart/image needs to be updated (it can be hidden or formatted so that it doesn't display anything) | ||
| + | |||
| + | ==Chart Viewports== | ||
| + | |||
| + | ===Version 9=== | ||
| + | |||
| + | In [[Version 9]], when displaying an Excel chart in a Viewport, it is possible to select the chart object itself rather than the Excel range of cells which contain the chart. The main advantage of this is that when the viewport size differs from the original chart size rather than stretching the image, the chart itself is re-drawn to the new dimensions. In most cases this will give a crisper display and avoid cases where legends and axes can look "fuzzy". | ||
| + | |||
| + | This approach is particularly useful on [[Dashboard sheets]], where the viewport size will change based on the screen size of the device it's being used on. Another advantage is the chart will automatically refresh when the underlying data changes. | ||
| + | |||
| + | [[Image:ViewportXLChart.JPG|350px|centre]] | ||
| + | |||
| + | ====Web Limitations==== | ||
| + | |||
| + | Due to the way charts are resized: | ||
| + | * You can not have two viewports on the same chart on one sheet. | ||
| + | ** But you can have them on different sheets. | ||
| + | |||
| + | * Charts may overlap standard range based viewports. | ||
| + | ** In this case you can move the chart to a different sheet from the range viewport. | ||
| + | |||
| + | ===Version 9.1=== | ||
| + | |||
| + | In [[Version 9.1]] you can also add viewports based on [[Small Multiple Charts]] and [[Treemaps]]. These give the same benefits of viewports on Excel charts, the fuzziness of resizing the chart is improved. | ||
| + | |||
| + | ==Popup Viewports== | ||
| + | |||
| + | Popup viewports are viewports that appear in a new window after a trigger cell has become active. | ||
| + | |||
| + | They can be managed with the ''Popup Viewport'' item under the Visualisation menu. | ||
| + | |||
| + | '''Trigger:''' a cell or range of cells that, once active, will cause the viewport to appear. | ||
| + | |||
| + | '''Range to display:''' the range to show, just as in a regular viewport. | ||
| + | |||
| + | '''Title:''' the title of the popup window. | ||
| + | |||
| + | [[File:Popup_Viewport1.PNG|400px|center]] | ||
| + | |||
| + | An [[XL3Link]] could be used inside the trigger cell as a way of passing in parameters. | ||
| + | |||
| + | For example, create a set of xl3links that pass in the selected year to a second sheet containing a grid. This grid is then filtered by this date (see [[Driving Grids from an Excel Range]]). | ||
| + | |||
| + | [[File:Popup_Viewport2.PNG|center]] | ||
| + | |||
| + | [[File:Popup_Viewport3.PNG|400px|center]] | ||
| + | |||
| + | |||
| + | Create a popup viewport which references the range of xl3links as its trigger, the [[Named Ranges|named range]] of the grid as its range to be displayed, and the cell containing the selected year as its trigger. | ||
| + | |||
| + | [[File:Popup_Viewport4.PNG|500px|center]] | ||
| + | |||
| + | |||
| + | Now, whenever one of the links is selected, a viewport showing the relevant year is displayed. | ||
| + | |||
| + | [[Category: Visualisations]] | ||
Latest revision as of 16:09, 18 December 2018
XLCubed Viewports help with the layout of variable length or width reports, allowing you to present information from one worksheet onto another. This can be useful in many presentation scenarios; for example, you can have separate worksheets for each business area, and bring them together on a formatted summary sheet.
Viewports have a number of advantages over standard Excel camera objects:
Scrollable
Viewports can reference a large area on the source sheet. If the Viewport control itself is smaller than the range, it will show vertical and horizontal scrollbars as required. This can be very useful for row dynamic reporting as the display area remains unchanged and additional parts of the report beneath the Viewport can remain in place even if the number of rows in the Viewport changes. They also support freeze panes so that the row and column headers can always be visible as you scroll.
Interactive
If the Viewport contains a Grid, the grid is still drillable and editable even through the Viewport. If there are active cell links which update other parts of the workbook these are still interactive in the Viewport.
Able to support named ranges
Viewports support named ranges being specified as the area (type in the name when picking a range). This works well when combined with specifying Named Ranges on Grids or Tables that have a dynamic number of rows/columns.
Contents
[hide]Creating a Viewport
Viewports are added from the Visualise menu on the XLCubed Ribbon. Specify the source range to be displayed, and where to insert the viewport control. You can also define the placement options and border settings as shown below.

Version 9
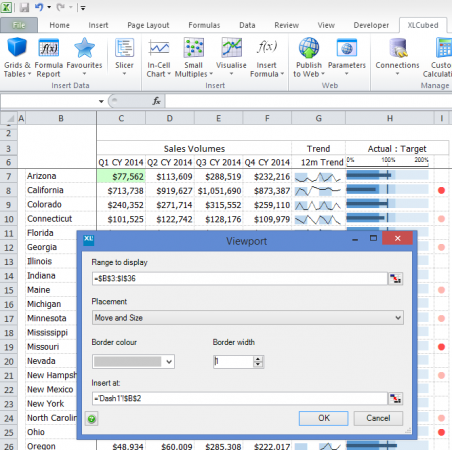
Previous versions


After insertion, the viewport control can be scrolled, any grids it contains can be drilled, and xl3link() and grid active cell settings are retained.

Excel Limitations
The viewport will only update when a cell value in the referenced range changes, so if it just contains a chart or image you may need to add a "Helper" cell to trigger the update. This can just be a reference to a cell that will be updated when the chart/image needs to be updated (it can be hidden or formatted so that it doesn't display anything)
Chart Viewports
Version 9
In Version 9, when displaying an Excel chart in a Viewport, it is possible to select the chart object itself rather than the Excel range of cells which contain the chart. The main advantage of this is that when the viewport size differs from the original chart size rather than stretching the image, the chart itself is re-drawn to the new dimensions. In most cases this will give a crisper display and avoid cases where legends and axes can look "fuzzy".
This approach is particularly useful on Dashboard sheets, where the viewport size will change based on the screen size of the device it's being used on. Another advantage is the chart will automatically refresh when the underlying data changes.

Web Limitations
Due to the way charts are resized:
- You can not have two viewports on the same chart on one sheet.
- But you can have them on different sheets.
- Charts may overlap standard range based viewports.
- In this case you can move the chart to a different sheet from the range viewport.
Version 9.1
In Version 9.1 you can also add viewports based on Small Multiple Charts and Treemaps. These give the same benefits of viewports on Excel charts, the fuzziness of resizing the chart is improved.
Popup Viewports
Popup viewports are viewports that appear in a new window after a trigger cell has become active.
They can be managed with the Popup Viewport item under the Visualisation menu.
Trigger: a cell or range of cells that, once active, will cause the viewport to appear.
Range to display: the range to show, just as in a regular viewport.
Title: the title of the popup window.

An XL3Link could be used inside the trigger cell as a way of passing in parameters.
For example, create a set of xl3links that pass in the selected year to a second sheet containing a grid. This grid is then filtered by this date (see Driving Grids from an Excel Range).


Create a popup viewport which references the range of xl3links as its trigger, the named range of the grid as its range to be displayed, and the cell containing the selected year as its trigger.

Now, whenever one of the links is selected, a viewport showing the relevant year is displayed.