| XLCubed is now FluenceXL. The new wiki can be found here: https://help.fluencexl.com/ |
Data Mashup
Data Mashup was introduced in Version 9, and allow tables from different data sources to be combined.
This can be useful for displaying OLAP, Relational and Excel data together, without the need for many error prone VLookUp() formulae.
Contents
[hide]Example
We will create a data mashup that retrieves sales data from a cube and product information from a relational database.
Firstly, we need to create 2 connections, one to each data source. Then select insert "Table..." from the Insert Data menu, select 'Add' on the Manage connections dialog and select the "Data Mashup" connection type in the 'New Connection' tab.
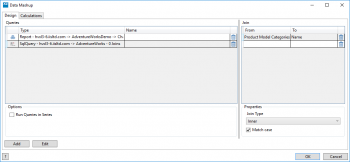
Then in the Data Mashup screen we add two queries, and join them by selecting the second query and picking the matching columns.
You can then use the normal table functionality, e.g. hiding columns (probably those joined on don't need to be in the table twice).
Options
- Run Queries in Series - Allows the delay of each query until the previous one has completed. Will reduce performance but can avoid sending multiple queries to the database at the same time if this is an issue.
- Join Type - Allows for inner/outer/cross joins. At least one column must be joined (except for cross joins).
- Match case - For join on text columns, should the case match. Default is true.
Calculations
You can add predefined calculated columns to the result set.
Currently the only calculation type is Coalesce, which will return the first non-null value from the selected columns. This is useful for selecting actual/budget, or the key value in a full outer join.
OLAP Datasources
When running against Analysis Services you will get a dialog to allow you to choose the report designer you want to use.
The standard grid designer is shown above, which will convert members on columns into columns of the table. You can also select member properties or the row members to display or join on.
If your data source supports DAX you will also get the option to use the tabular report designer.


