| XLCubed is now FluenceXL. The new wiki can be found here: https://help.fluencexl.com/ |
Template Tables
Template tables allow you to easily add predefined tables that have useful metrics and formatting built into them. These can be used directly or further customised for your specific needs.
Contents
[hide]General features
The tables can be built on top of a cube or Pivot View which allows calculations to be built into the column definitions, and for users to drill down on the row members.
Columns can be formatted with standard number styles, or be displayed as in-cell charts for simple visualisation.
IBCS formatting can be applied to indicated data categories like Actual, Plan and Forecast.
It is very useful (but not essential) to define Business Rules in your workbook. When these are found the template will automatically be populated with defaults, and a table can be build with just a few selections. The templates use the same rules as Business Charts. If you don't have any rules defined you can still make the selections you need in the designer.
Built in templates
| 1. Numeric Variances | 2. Chart Variances |
| Compare Actuals to Plan and Previous Year, for Current Month and YTD. | Compare Actuals to Previous Year, with incell charts, for Current Month and YTD. |
| 3. Time Comparison | 4. Integrated Waterfalls |
| Compare Plan to Actual or Forecast, over multiple Time periods. | Compare Account Actuals to Previous Year or Plan, with waterfall and percentage deltas. |
| 5. Time Butterfly | |
| View Actual and Forecast, over multiple Time periods. | |
Configuration
The template designer allows you to insert tables based on the provided template and to customise the calculation and appearance for each column.
The main areas are
- Template - The initial design of the table and columns. This controls the formatting of the columns and the required inputs for calculations. Pressing the Apply button will clear the current columns and generate new ones based on the current selections.
- Design - Table table layout allows you to define the Filters which apply to the whole table. It is common to define a Measure and the Current Month in this area.
- Columns - Initially blank, this is populated once you press the "Apply button". You can then customise the columns generated.
- Calculations - Used to define parameters for any calculations that are required, e.g. for YTD columns.
Business Rules
If you have defined Business Rules in your workbook then much of the information required will be prefilled.
For example if you want to use IBCS Template 1 then the following can be pre-populated:
- Design
- Current Month
- Acutal Measure
- Budget Measure
- Calculations
- Date hierarchy
- Year level
Template
The start point for the table design. You can hover over a template type to see an example table.
Design
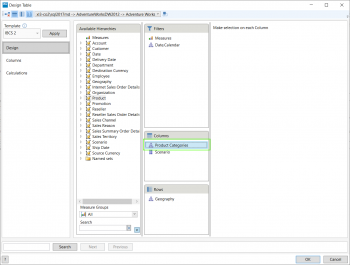
The Filters area allows you to make selections that apply for the entire table. Commonly you will choose the relevant Measure and Current Time period here, along with any other filters that you want to make.
The Columns area has selections that generate the columns generated when you Apply a template. The selections required here depend on the selected template, and discussed further below.
The Rows area defines the members that are on the report rows. These can be drilled-down once the the report has been inserted. This can usually be any hierarchy you want, except for IBCS Template 4 where the rows must be the Account hierarchy.
The "Columns" selection area
There are two main type template, split by Scenario or by Time. Depending on the template selected you'll be prompted to pick the members of these. In each case you can choose from a drop down of the members defined in the rules or pick a different member from the hierarchy.
- For most templates you need to pick a Scenario hierarchy on Columns.
- For IBCS Template 3 you also need to pick the current year and a number of previous years to generate the report for.
- For Time Butterfly you need to pick the current month, and the months from that year will be automatically selected.
Columns
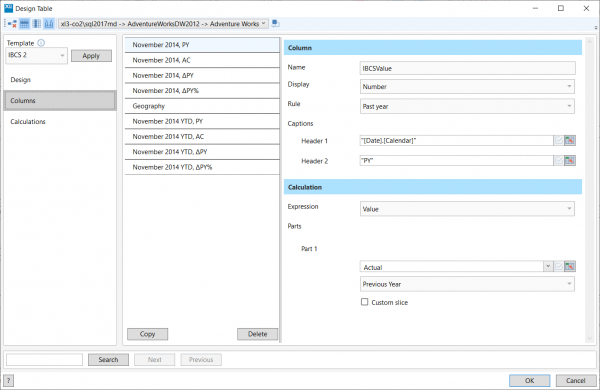
The Columns tab has two sections; a list of the columns in the table and the defintion of each column.
Columns can be added, reordered and deleted in the column list. Copying an existing column can give you a good starting point for new columns, so try to copy a column similar to the requirements when adding new columns.
Column Properties
- Column
- Name - Used to format the column, this is the name of the format to use from the Format Sheet. This is not displayed.
- Display - Choose how the value is displayed, either as a number of chart.
- Rule - Business rule that the column represents, controls the column format indicators at the top and bottom of the column.
- Caption - This has an entry for each row in the column titles. You can use a hierarchy unique name as a placeholder and it will be replaced with the relevant member when the table is rendered. Columns which have the same titles will have the title cells merged.
- Value (optional)
- Selection - Only appears when the columns are split by a secondary hierarchy, e.g. in IBCS Template 3 when each column is for a Year and Scenario.
- This is also discussed in the Advanced section.
- Calculation
- Expression - The type of calculation in the column. This can be a simple value, delta or percentage. Each calculation can be made of several parts, e.g.
Delta = Part 1 - Part 2 - Parts - Each Expression Part is made of 3 inputs
- Member - the value to use, often a scenario.
- Date part - defaults to current period, but could be Previous Year, Year To Date...
- Custom Slice - this is discussed later in the Advanced section.
- For example the defintion to "Actual value, Delta to Previous Year" uses the Actual value in each part, but the second uses the "Previous Year" Date part.

- Expression - The type of calculation in the column. This can be a simple value, delta or percentage. Each calculation can be made of several parts, e.g.
Calculations
Often template columns define a time calculation, and some parameters are required to create these. If you have defined business rules in the workbook these will normally be filled in for you, but if not you can select the Time hierarchy and Year level so that Year To Data calculations can be created.
If you have a date dimension with year and month levels then only that hierarchy needs to be configured. This is most common with Analysis Services cubes when Year -> Quarter -> Month stucture is common.
If you have two date dimensions, one with years and a second with months then both will need to be configured. This is common with TM1 cubes which often have separate year and month dimensions.
In both cases, if the "Current Year" and "Current Month" rules are set up in the Business Rules sheet then the configuration wil be automatically set up for you.
| One date dimension | Two date dimensions |
Advanced
Conditional Formatting
Conditional formatting can be applied to a column by editing the format sheet. This is the same way that it is done for Grids and Tables.
In this example I will add conditional formatting on any Delta % columns where the decrease is over 10%.
- Firstly copy the existing "IBCSDeltaPct" format and add a copy renamed to "IBCSDeltaPct Down 10%".
- Then add a conditional format to the data cell with the required formatting rule.
- Finally rename the Delta % columns in the designer and press OK
| Edit format sheet | Edit column names | Result |
Column selections from range
Template tables can be driven from Excel ranges in the same way that other XLCubed report objects can be.
In this example I want to change a Time butterfly report to be dynamic as a month input changes. When the template columns are generated the months selected each create a new column with a fixed month in it. Instead of having many columns to update we want to have a small number of columns defined, and then use the Excel range to create the months selection.
This will be done using MDXSet:. In this case I have a simple switch over cell, but you could create more complex logic (using XL3MemberNavigate could be useful).
| Initial table | Initital columns | MDXSet: definition cells |
| Columns driven from Range | Result Table | |
Custom Slices
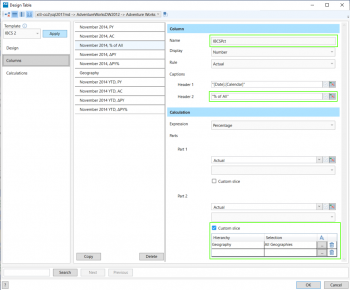
Setting a custom slice on a calculation part allows you to override the selection used to calculate a number. A common use of this is to display a delta or percentage between the current value and the "All" value or a reference member.
In these examples we start with the default setup for IBCS Template 2 and add three different custom slice calculations.
- Filter percentage of "All"
- Row percentage of "All"
- Row percentage of Parent
| Column Definition | Result |
| Column Definition | Result |
For the "% Of Parent" calculation an MDX: statement is needed so that the selection is dynamic with every row. In this case cell $A$35 contains MDX:[Geography].[Geography].CurrentMember.Parent
| Column Definition | Result |
Repeating Columns
If your report requires a column to be repeated for different members this can be done without duplicating the column definition.
Instead, you can add an extra hierarchy to the Columns area on the Design tab. This must go before the required hierarchies (normally Scenario).
Once you have do this the "Value" option will appear on each column definition, and you can select the member for the context of the column.
If you were to just select a single member this would be the same as adding that member to the custom slice of the Expression, but you can instead select a range of members to get a dynamic number of columns created in the final report.
Note that the repeated columns will always appear next to each other, they cannot be separated by other columns.
| Range contents | Add hierarchy |
| Define column | Result |


