| XLCubed is now FluenceXL. The new wiki can be found here: https://help.fluencexl.com/ |
Difference between revisions of "FAQ"
(→Double-clicking on my grid report returns different results to a similar formula report. Why does this happen?) |
(→Publishing) |
||
| (26 intermediate revisions by 3 users not shown) | |||
| Line 1: | Line 1: | ||
| − | ===I | + | ==Evaluation== |
| − | + | ====I am trying to evaluate XLCubed but cannot connect to the Bicycle Sales cube that comes with the evaluation copy of the software==== | |
| + | The Bicycle Sales cube is in Analysis Services 2000 format. If you are running 64-bit Office products you will not be able to connect to it. If you would like to evaluate XLCubed by connecting to your own data cubes, please contact XLCubed Support at [mailto:support@xlcubed.com support@xlcubed.com] | ||
| − | + | ==Installation== | |
| − | + | ====I have re-installed XLCubed and get the following error:==== | |
| − | + | [[Image:FAQ1.png|350px|centre]] | |
| − | + | ||
| − | + | Perform the following steps: | |
| − | + | * Ensure that the license file is in the folder: \inetpub\wwwroot\XLCubedWeb. | |
| + | * You will need to restart IIS – you can do this by Start, Run, iisreset (this stops and restarts the service) | ||
| + | * You should then be able to publish/browse to the site as normal. | ||
| − | + | ====I have installed XLCubed Excel Edition. Why do I not see the XLCubed ribbon when I go into Excel?==== | |
| − | |||
| − | + | You need to enable the XLCubed ribbon to appear within Excel. | |
| − | |||
For further information go to: | For further information go to: | ||
| − | [[ | + | [[Installation|Enable XLCubed Ribbon]] |
| − | ===I have made a change to the row format in the XLCubedFormat sheet but there is no change to the grid. Why has it not refreshed?=== | + | ==Grids== |
| + | ====I have made a change to the row format in the XLCubedFormat sheet but there is no change to the grid. Why has it not refreshed?==== | ||
After you change the format on the format sheet you need to go to your grid sheet and refresh the grid. The new format will then be displayed. | After you change the format on the format sheet you need to go to your grid sheet and refresh the grid. The new format will then be displayed. | ||
| − | ===How | + | ====I have more than one grid in my spreadsheet and I want different conditional formatting for each grid. How do I achieve this?==== |
| − | + | This can be done through the XLCubedFormat Sheet. | |
For further information go to: | For further information go to: | ||
| − | [[ | + | [[Formatting Grids#Formatting directly through Format Sheet|Formatting directly through Format Sheet]] |
| + | |||
| + | ====Double-clicking on my grid report returns different results to a similar formula report. Why does this happen?==== | ||
| − | + | The screenshot below shows a grid report on the left and a formula on the right which look very similar but behave differently. | |
| − | |||
| − | + | [[Image:FAQ7.png|400px|centre]] | |
| − | [[ | ||
| − | |||
| − | |||
| − | |||
| − | + | Double-clicking on All Products on the Germany row in both grid and formula reports results in the different behaviour as can be seen in the next screenshot: | |
| − | |||
| − | + | * the grid report expands All Products across All Geographies to show Product Categories | |
| − | + | * the formula report just expands All Products for Germany to show Product Categories only for Germany. | |
| − | + | This behaviour in grid-based reporting is intentional. On occasions when you do not want this to happen it would better to use a formula report. | |
| − | [[ | + | [[Image:FAQ8.png|350px|centre]] |
| − | ===I have | + | ====I have a grid report on which I want to sort on a measure by category and then within that, sub-category. How can I achieve this within XLCubed?==== |
| + | This can be achieved by setting up a sort on the grid members. | ||
| − | [[ | + | For further information go to: |
| − | + | [[Ranking, Sorting and Filtering|Sorting by sub-category within category]] | |
| − | |||
| − | |||
| − | |||
| − | |||
| − | ===I | + | ==Slicers== |
| + | ====When I publish a formula report to the web why can I not choose or change the slicer?==== | ||
| + | In Excel, go to the XLCubed tab and choose workbook options. Under the web publishing tab there is a setting to ‘Edit Member Formulae’ which you need to set to yes before publishing. | ||
| − | + | For further information go to: | |
| + | [[XLCubed_Options#Workbook_Options|Workbook options]] | ||
| − | + | ====Is it possible to sort the elements of a slicer alphabetically, without setting the order separately for each element?==== | |
| + | Right-click on slicer and select Edit. Select the Advanced tab and then choose to Sort Result. Click the drop-down by Sort Asc and Edit Sort. Select Sort Ascending (A-Z) and then OK. For | ||
| − | + | For further information go to: | |
| + | [[Ranking,_Sorting_and_Filtering#Step_4:_Sorting_slicer_elements| Sorting slicer elements]] | ||
| − | + | ====I want to use a slicer to allow the selection of a country and then have the corresponding country code displayed or passed to another report as a parameter. How can I achieve this?==== | |
| − | + | This can be achieved by the creation of a slicer that selects its values from a range of cells. | |
| − | |||
| − | + | For further information go to: | |
| + | [[Slicers|Slicers To Display Country Code]] | ||
| − | + | ====How do I drive a chart from a slicer? How can I choose whether to plot days or months for a particular period?==== | |
| − | + | You can use XLCubed to create a report which is based on a slicer that allows the user to switch between showing the graph data based on quarters, months or days. | |
| − | + | For more information on this topic go to: | |
| + | [[Grid Charts#Time_Series_Graphing|Time Series Graphing]] | ||
| − | + | ==Formatting== | |
| + | ====Can you do conditional formatting on a cell using standard Excel conditional formatting?==== | ||
| + | XLCubed supports the same conditional formatting as available with Excel 2003. | ||
| + | With a grid report, you should use the XLCubed format sheet to conditionally format the cell format. | ||
| + | With a formula report, you use standard Excel conditional formatting. | ||
| − | + | For further information go to: | |
| + | [[Formatting_Grids#Formatting_directly_through_Format_Sheet|Formatting directly through Format Sheet]] | ||
| − | + | ====I have a field in a cube that is formatted as a percentage. When I create a formula report using this field, its formatting disappears and it is displayed as a number. How can I make it format as a %?==== | |
| − | + | Formatting in a formula report can only be achieved using standard Excel formatting. Previous formatting will be ignored by the formula report generation. Grid reporting allows the user to format through the right-click menu. | |
| − | [[ | + | For more information on formatting grids go to: |
| + | [[Formatting_Grids#Right_Click_Formatting|Right click formatting]] | ||
| − | + | ==Calculations== | |
| − | + | ====I have created a new member which is the sum of two others. I wish to amend/delete this member? How do I do that?==== | |
| + | The new element will appear as a custom calculation. So, select the custom calculation tab on the XLCubed ribbon and you should be able to amend or delete it as you wish. | ||
| − | + | For further information go to: | |
| + | [[Grid_Calculations#Member_Selector_-_Adhoc_Groupings|Member Selector - Adhoc Groupings]] | ||
| + | ====I have used the new grouping member feature and created a new element which is the sum of two others. How do I delete or amend this element?==== | ||
| − | + | The new element will appear as a custom calculation. Select the custom calculation tab on the XLCubed ribbon and you should be able to amend or delete it as you wish. | |
| − | === | + | [[image:GridCalc7.png|350px|centre]] |
| + | |||
| + | ==Publishing== | ||
| + | ====How can I prevent drill-down on published web reports on V6?==== | ||
| + | Before you publish your report, right-click on your grid, select XLCubed and Properties tab, Lockdown tab and scroll down to ‘Can drill rows’ – select drop-down and set to No and OK. | ||
| − | + | For further information go to: | |
| + | [[Grid_Properties#Lockdown_Options|Lockdown Options]] | ||
| − | + | ====When I publish my pie chart in Web edition why do I only see one colour across the chart?==== | |
| − | + | This is a known issue in Version 6, upgrading to Version 7 will resolve the problem. | |
| − | + | For further information go to: | |
| − | + | [[Pie Charts|Pie Charts in Web Edition]] | |
| − | + | ==Web PDF Printing== | |
| − | + | ====How can I use indentation with PDF printed reports?==== | |
| + | PDF reports don't support indentation using Excel's ''Text alignment'' feature. Instead, use a number format to add some space before the value. For example, this one adds four spaces before any text value: | ||
| + | {{Code|;;;" "@}} | ||
| + | ==See Also== | ||
| + | * [[XLCubed Excel Edition Troubleshooting]] | ||
[[Category:Troubleshooting]] | [[Category:Troubleshooting]] | ||
| + | [[Category:Main Page/Troubleshooting]] | ||
Latest revision as of 10:02, 10 April 2014
Contents
[hide]- 1 Evaluation
- 2 Installation
- 3 Grids
- 3.1 I have made a change to the row format in the XLCubedFormat sheet but there is no change to the grid. Why has it not refreshed?
- 3.2 I have more than one grid in my spreadsheet and I want different conditional formatting for each grid. How do I achieve this?
- 3.3 Double-clicking on my grid report returns different results to a similar formula report. Why does this happen?
- 3.4 I have a grid report on which I want to sort on a measure by category and then within that, sub-category. How can I achieve this within XLCubed?
- 4 Slicers
- 4.1 When I publish a formula report to the web why can I not choose or change the slicer?
- 4.2 Is it possible to sort the elements of a slicer alphabetically, without setting the order separately for each element?
- 4.3 I want to use a slicer to allow the selection of a country and then have the corresponding country code displayed or passed to another report as a parameter. How can I achieve this?
- 4.4 How do I drive a chart from a slicer? How can I choose whether to plot days or months for a particular period?
- 5 Formatting
- 6 Calculations
- 7 Publishing
- 8 Web PDF Printing
- 9 See Also
Evaluation
I am trying to evaluate XLCubed but cannot connect to the Bicycle Sales cube that comes with the evaluation copy of the software
The Bicycle Sales cube is in Analysis Services 2000 format. If you are running 64-bit Office products you will not be able to connect to it. If you would like to evaluate XLCubed by connecting to your own data cubes, please contact XLCubed Support at support@xlcubed.com
Installation
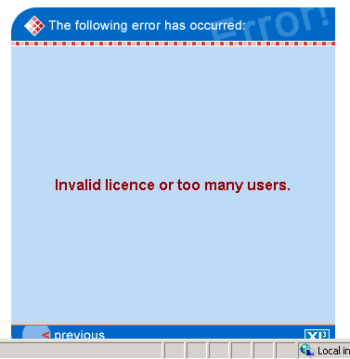
I have re-installed XLCubed and get the following error:
Perform the following steps:
- Ensure that the license file is in the folder: \inetpub\wwwroot\XLCubedWeb.
- You will need to restart IIS – you can do this by Start, Run, iisreset (this stops and restarts the service)
- You should then be able to publish/browse to the site as normal.
I have installed XLCubed Excel Edition. Why do I not see the XLCubed ribbon when I go into Excel?
You need to enable the XLCubed ribbon to appear within Excel.
For further information go to: Enable XLCubed Ribbon
Grids
I have made a change to the row format in the XLCubedFormat sheet but there is no change to the grid. Why has it not refreshed?
After you change the format on the format sheet you need to go to your grid sheet and refresh the grid. The new format will then be displayed.
I have more than one grid in my spreadsheet and I want different conditional formatting for each grid. How do I achieve this?
This can be done through the XLCubedFormat Sheet.
For further information go to: Formatting directly through Format Sheet
Double-clicking on my grid report returns different results to a similar formula report. Why does this happen?
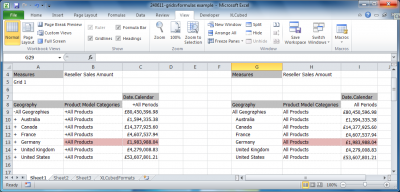
The screenshot below shows a grid report on the left and a formula on the right which look very similar but behave differently.
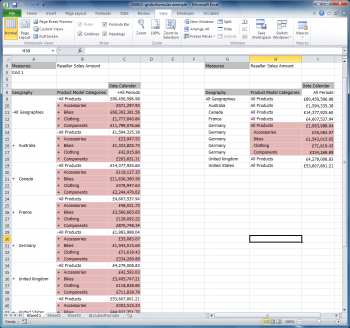
Double-clicking on All Products on the Germany row in both grid and formula reports results in the different behaviour as can be seen in the next screenshot:
- the grid report expands All Products across All Geographies to show Product Categories
- the formula report just expands All Products for Germany to show Product Categories only for Germany.
This behaviour in grid-based reporting is intentional. On occasions when you do not want this to happen it would better to use a formula report.
I have a grid report on which I want to sort on a measure by category and then within that, sub-category. How can I achieve this within XLCubed?
This can be achieved by setting up a sort on the grid members.
For further information go to: Sorting by sub-category within category
Slicers
When I publish a formula report to the web why can I not choose or change the slicer?
In Excel, go to the XLCubed tab and choose workbook options. Under the web publishing tab there is a setting to ‘Edit Member Formulae’ which you need to set to yes before publishing.
For further information go to: Workbook options
Is it possible to sort the elements of a slicer alphabetically, without setting the order separately for each element?
Right-click on slicer and select Edit. Select the Advanced tab and then choose to Sort Result. Click the drop-down by Sort Asc and Edit Sort. Select Sort Ascending (A-Z) and then OK. For
For further information go to: Sorting slicer elements
I want to use a slicer to allow the selection of a country and then have the corresponding country code displayed or passed to another report as a parameter. How can I achieve this?
This can be achieved by the creation of a slicer that selects its values from a range of cells.
For further information go to: Slicers To Display Country Code
How do I drive a chart from a slicer? How can I choose whether to plot days or months for a particular period?
You can use XLCubed to create a report which is based on a slicer that allows the user to switch between showing the graph data based on quarters, months or days.
For more information on this topic go to: Time Series Graphing
Formatting
Can you do conditional formatting on a cell using standard Excel conditional formatting?
XLCubed supports the same conditional formatting as available with Excel 2003. With a grid report, you should use the XLCubed format sheet to conditionally format the cell format. With a formula report, you use standard Excel conditional formatting.
For further information go to: Formatting directly through Format Sheet
I have a field in a cube that is formatted as a percentage. When I create a formula report using this field, its formatting disappears and it is displayed as a number. How can I make it format as a %?
Formatting in a formula report can only be achieved using standard Excel formatting. Previous formatting will be ignored by the formula report generation. Grid reporting allows the user to format through the right-click menu.
For more information on formatting grids go to: Right click formatting
Calculations
I have created a new member which is the sum of two others. I wish to amend/delete this member? How do I do that?
The new element will appear as a custom calculation. So, select the custom calculation tab on the XLCubed ribbon and you should be able to amend or delete it as you wish.
For further information go to: Member Selector - Adhoc Groupings
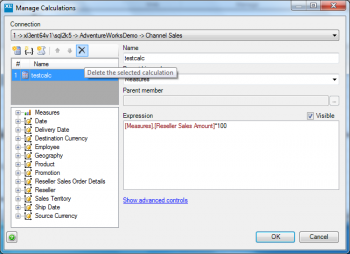
I have used the new grouping member feature and created a new element which is the sum of two others. How do I delete or amend this element?
The new element will appear as a custom calculation. Select the custom calculation tab on the XLCubed ribbon and you should be able to amend or delete it as you wish.
Publishing
How can I prevent drill-down on published web reports on V6?
Before you publish your report, right-click on your grid, select XLCubed and Properties tab, Lockdown tab and scroll down to ‘Can drill rows’ – select drop-down and set to No and OK.
For further information go to: Lockdown Options
When I publish my pie chart in Web edition why do I only see one colour across the chart?
This is a known issue in Version 6, upgrading to Version 7 will resolve the problem.
For further information go to: Pie Charts in Web Edition
Web PDF Printing
How can I use indentation with PDF printed reports?
PDF reports don't support indentation using Excel's Text alignment feature. Instead, use a number format to add some space before the value. For example, this one adds four spaces before any text value:
;;;" "@


