| XLCubed is now FluenceXL. The new wiki can be found here: https://help.fluencexl.com/ |
Difference between revisions of "Data Mashup"
| Line 10: | Line 10: | ||
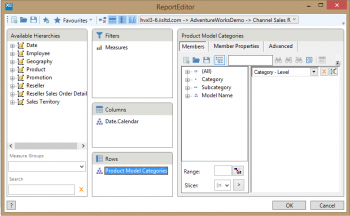
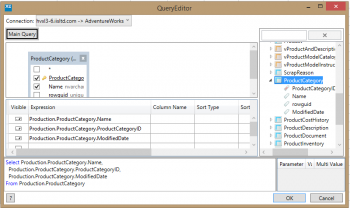
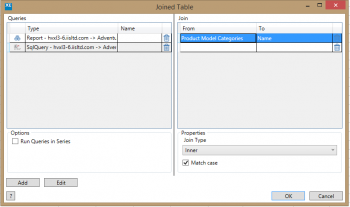
Then in the Joined Tables screen we add two queries, and join them by selecting the second query and picking the matching columns. | Then in the Joined Tables screen we add two queries, and join them by selecting the second query and picking the matching columns. | ||
| − | [[ | + | [[File:JoinedTablesCube.png|350px|centre]] |
Cube query layout | Cube query layout | ||
| − | [[ | + | [[File:JoinedTablesSql.png|350px|centre]] |
Sql Layout | Sql Layout | ||
| − | [[ | + | [[File:JoinedTables1.png|350px|centre]] |
Join columns | Join columns | ||
| − | [[ | + | [[File:JoinedTables2.png|350px|centre]] |
Result table | Result table | ||
Revision as of 14:51, 29 April 2016
Joined tables were introduced in Version 9, and allow tables from different data sources to be combined.
This can be useful for displaying OLAP, Relational and Excel data together, without the need for many error prove VLookUp() formulae.
Example
We will create a joined table that retrieves sales data from a cube and product information from a relational database.
Firstly, we need to create 2 connections, one to each data source.
Then in the Joined Tables screen we add two queries, and join them by selecting the second query and picking the matching columns.
Cube query layout
Sql Layout
Join columns
Result table


